Right-click on the Overview pane to change the view options.
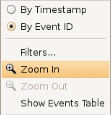
This menu includes:
- By Timestamp
- Show the events sorted by their timestamp. Because several memory events can occur with the same time stamp, this might present the events in a confusing order (for example, a buffer's allocation and deallocation events could be shown in the wrong order if they happen during the sampling interval).
- By Count
- Show events sorted by their event index. This is the default ordering in the Overview pane.
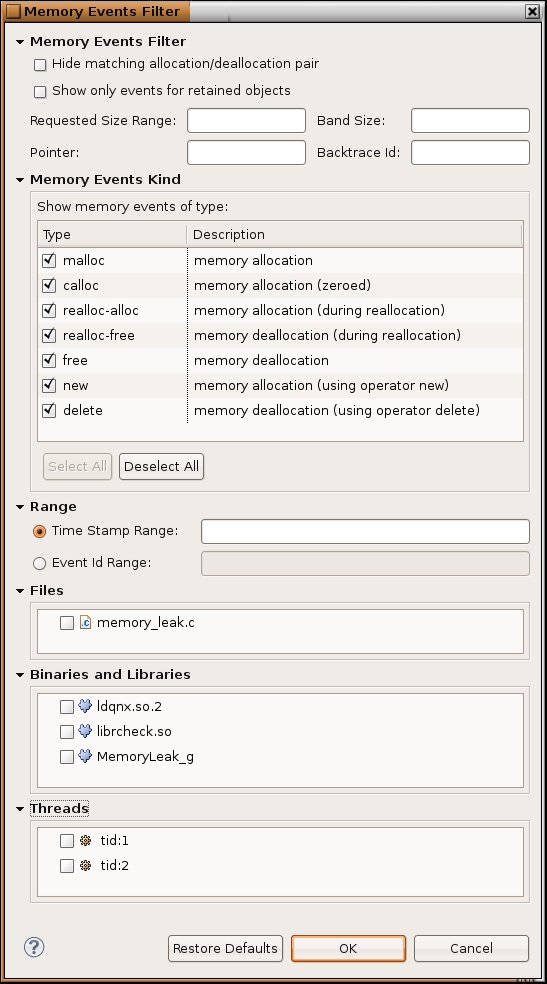
- Filters...
- Filter the events that are shown by size, type, or both. You can also hide the matching allocations and deallocations, so that you see only the unmatched ones:
- Zoom In
- Zoom in on the selected range of events.
- Zoom Out
- Zoom out to the set of memory events that you previously zoomed in on.